GAMV program from GSLIB is a robust tool for measuring spatial variablity. Here, I would like to share how I use GAMV in python. To implement this workflow pygeostat module need to be installed, also gamv.exe and datafiles need to be stored in the same directory.
# Importing Modules
import pandas as pd
import pygeostat as gs
import re
# Importing GSLIB format datafiles into project
ninety7 = gs.DataFile('97data.dat')# Viewing Data Table
print(ninety7.data)Xlocation Ylocation Primary Secondary Declustering Weight 0 39.5 18.5 0.06 0.22 4.000 1 5.5 1.5 0.06 0.27 4.000 2 38.5 5.5 0.08 0.40 3.500 3 20.5 1.5 0.09 0.39 4.500 4 27.5 14.5 0.09 0.24 3.333 .. … … … … … 92 39.5 31.5 8.34 8.02 0.843 93 17.5 15.5 9.08 3.32 1.100 94 2.5 14.5 10.27 5.67 1.061 95 30.5 41.5 17.19 10.10 0.889 96 35.5 32.5 18.76 10.76 0.646
[97 rows x 5 columns]
# importing GAMV executable program into project (gamv.exe should be on the project folder)
gamv_p = gs.Program(program='gamv')
# Defining GAMV parameter file template and Variogram type dictionary
parstr = """ Parameters for GAMV
*******************
START OF PARAMETERS:
{file} - file with data
{icolx} {icoly} {icolz} - columns for X, Y, Z coordinates
{nvar} {ivar} - number of variables,col numbers
{tmin} {tmax} - trimming limits
{output} - file for variogram output
{nlag} - number of lags
{xlag} - lag separation distance
{xtol} - lag tolerance
1 - number of directions
{azm} {atol} {bandh} {dip} {dtol} {bandv} - azm,atol,bandh,dip,dtol,bandv
{standardize} - standardize sills? (0=no, 1=yes)
1 - number of variograms
{ivtail} {ivhead} {ivtype} - tail var., head var., variogram type
"""
# Dictionary of variogram type
vartypedict = { 1 : 'semivariogram',
2 : 'cross-semivariogram',
3 : 'covariance',
4 : 'correlogram',
5 : 'general-relative',
6 : 'pairwise-relative',
7 : 'semivariogram-of-logarithms',
8 : 'semimadogram',
9 : 'indicator-semivariogram-continuous',
10 : 'indicator-semivariogram-categorical' }
Now, This block of code below is for customizing GAMV parameter file, Fill out ‘pars’ dictionary variables. Also, we can use for loop to implement more than one varible values. In this example below, I perform GAMV for different variogram type.
# Defining dictionary for variable for storing gamv ouput file
variogram = {}

# Run GAMV Program in loop for specified parameter (EDIT THE GAMV PARAMETER HERE, use for loop if needed)
for each in [1,3,4,5,6,7,8]:
    pars = dict(file        = ninety7.flname,
                icolx       = 1,
                icoly       = 2,
                icolz       = 0,
                nvar        = 1,
                ivar        = 3,

                tmin        = -999999,
                tmax        = 999999,

                nlag        = 40,
                xlag        = 4,
                xtol        = 2,

                azm         = 0,
                atol        = 90,
                bandh       = 50,

                dip         = 0,
                dtol        = 10,
                bandv       = 10,

                standardize = 1,
                ivtail      = 1,
                ivhead      = 1,
                ivtype      = each)


    # Output filename format
    out = vartypedict[pars['ivtype']]+'_'+re.match("^.*(?=\.)", pars['file']).group(0)+'_col{ivar}_{azm}_{dip}.out'.format(**pars)

    # Executing GAMV Program
    gamv_p.run(parstr=parstr.format(**pars, output=out), quiet=True, liveoutput=False)

    # Reformating GAMV output to GSLIB datafile format supported for pygeostat plotting
    gs.write_gslib(pd.read_fwf(out, skiprows=1,
                               names=['Nlag', 'Distance','Variogram', 'numpairs', 'Mtail', 'Mhead']),
                   flname=out, title=out)

    # Storing the resulted variogram into dictionary
    variogram[vartypedict[pars['ivtype']]+'_'+re.match("^.*(?=\.)", pars['file']).group(0)+'_col{ivar}_{azm}_{dip}'.format(**pars)] = gs.DataFile(out)
By Running the code above GAMV output file will be stored in project folder and a dictionary variable named “variogram” that store filename as keys and DataFile as Values.
# View variogram file stored in 'variogram' dictionary
variogram.keys()
dict_keys([‘semivariogram_97data_col3_0_0’, ‘covariance_97data_col3_0_0’, ‘correlogram_97data_col3_0_0’, ‘general-relative_97data_col3_0_0’, ‘pairwise-relative_97data_col3_0_0’, ‘semivariogram-of-logarithms_97data_col3_0_0’, ‘semimadogram_97data_col3_0_0’])
# View 5 first line of 'semivariogram_97data_col3_0_0' table
print(variogram['semivariogram_97data_col3_0_0'].head(5))
Nlag Distance Variogram numpairs Mtail Mhead 0 1.0 0.000 0.00000 194.0 2.21113 2.21113 1 2.0 1.833 0.04498 14.0 1.09429 1.09429 2 3.0 4.504 0.86877 316.0 2.37076 2.37076 3 4.0 8.095 0.90821 648.0 2.22835 2.22835 4 5.0 11.921 1.13214 848.0 2.35797 2.35797
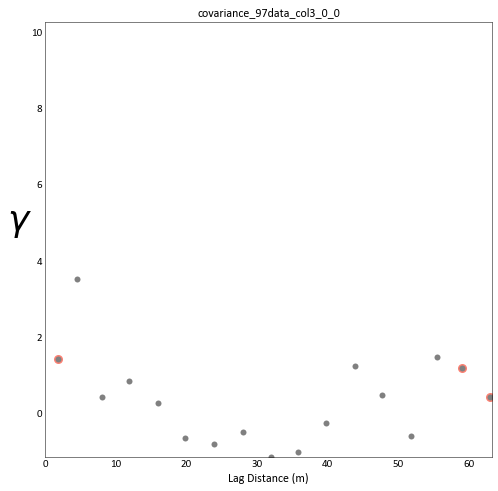
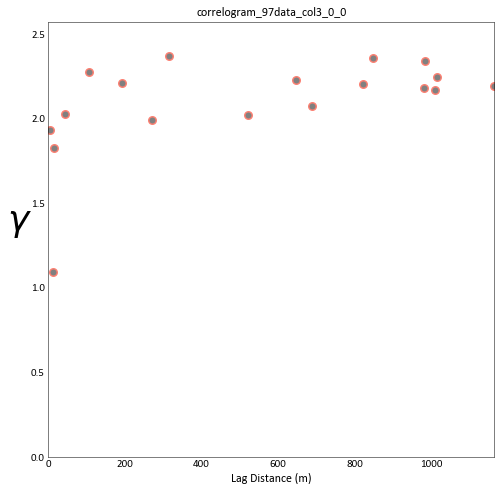
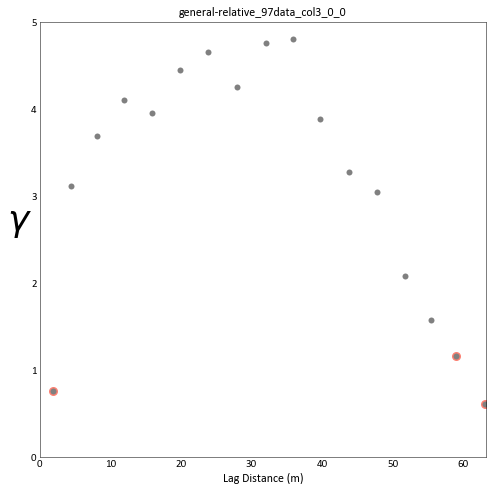
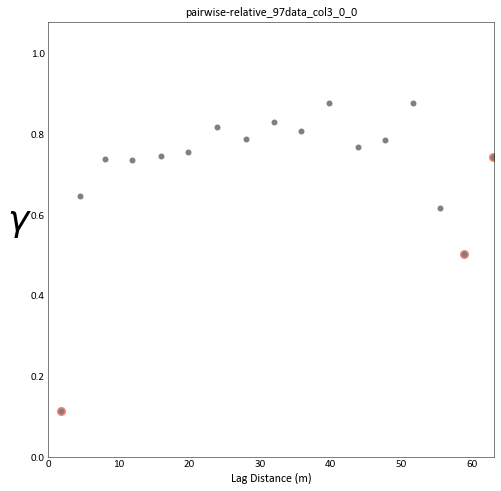
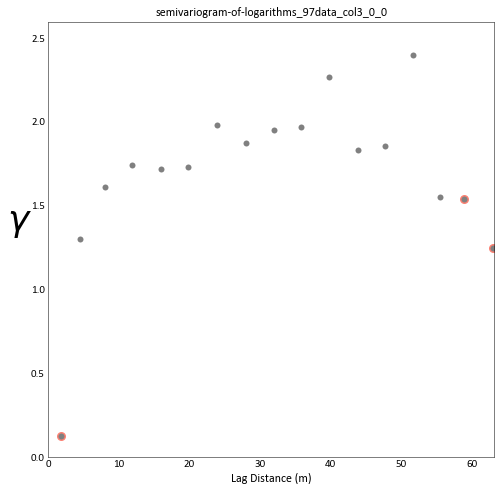
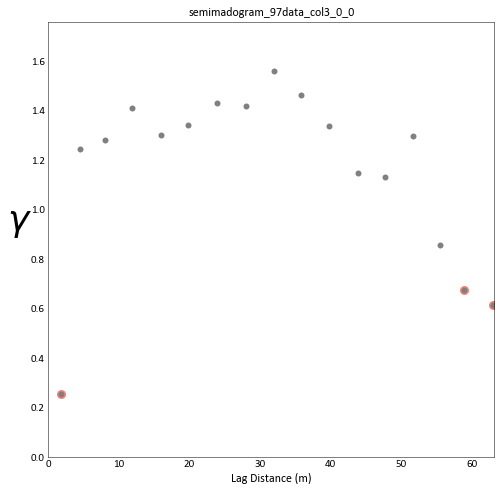
Now, let’s plot the variogram using for looop and pygeostat module.
# Plot the resulted variograms using for loop
for key in variogram.keys():
    ymin = variogram[key].data.Variogram.min()
    ymax = variogram[key].data.Variogram.max()
    xmin = variogram[key].data.Distance.min()
    xmax = variogram[key].data.Distance.max()

    gs.variogram_plot(variogram[key], title=key,
                      ylim=(ymin, ymax+0.2),
                      xlim=(xmin, xmax+0.2),
                      experimental=True,
                      sill=False)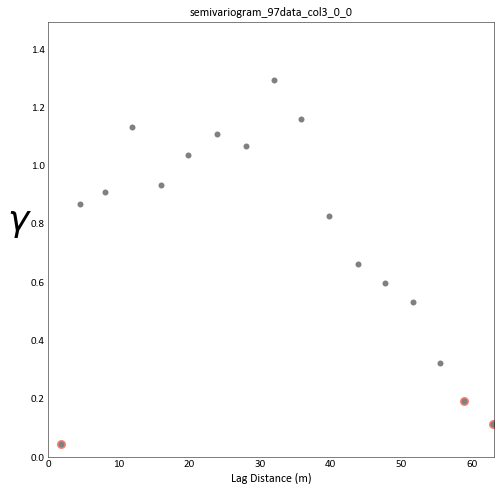
Reference
-
Deutsch, C. V., & Journel, A. G. (1998). GSLIB: Geostatistical software library and user’s guide. New York: Oxford University Press.
-
Pygeostat Documentation. http://www.ccgalberta.com/pygeostat/welcome.html